Has the web stopped getting heavier?
 by
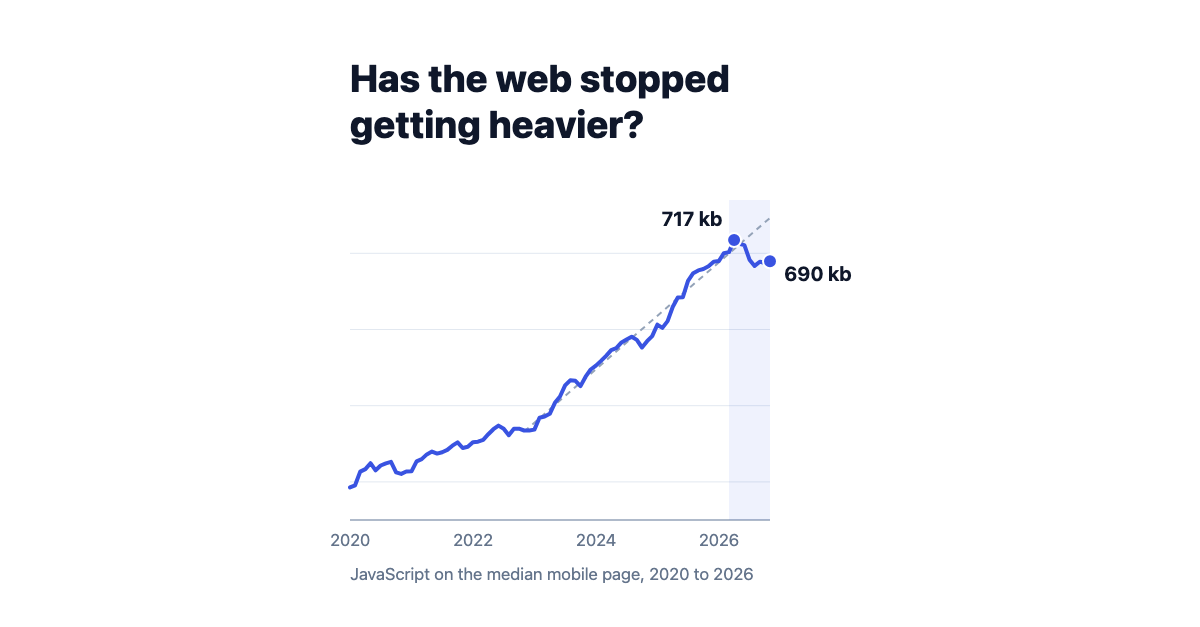
In April, Ethan Gardner showed that web pages started gaining JavaScript almost three times faster after November 2022. We extended his analysis by eight months. Growth has nearly stalled: the median page gained 7 kb of JavaScript in the past year, against 70 kb a year before.
TL;DR #
- Ethan Gardner's analysis ended in March 2026. Until then the median mobile page gained about 70 kb of JavaScript a year. In the past twelve months it gained 7 kb.
- The median peaked in April at 717 kb and now sits at 690 kb. About half of that drop is real. The other half comes from a change in which pages HTTP Archive measures.
- The heaviest 10% of pages keep growing. Their JavaScript grew 4.1% in a year, and 2.3% since April.
- The median page still ships 76% more JavaScript than in January 2020, in roughly the same number of files.
What Ethan Gardner found #
In April 2026, Ethan Gardner published An Objective Analysis of AI's Impact on Page Weight. He took 75 months of HTTP Archive data, from January 2020 to March 2026, and fitted two straight lines through it: one before ChatGPT launched in November 2022 and one after.
The line bends at that point. Page weight and JavaScript weight both grow faster after November 2022 than before, on mobile and desktop, at the median and at the 75th and 90th percentile. The bend is sharpest for JavaScript on the median page. Ethan describes this as a correlation with the adoption of AI, and so do we.
I have used his chart in talks since. Refitting his method on the mobile median gives 25 kb of extra JavaScript per year before November 2022 and 70 kb per year after. That is 2.8 times faster.
His data stopped in March. I have kept rerunning the numbers since, and this is what the extra months show.
Eight more months of data #
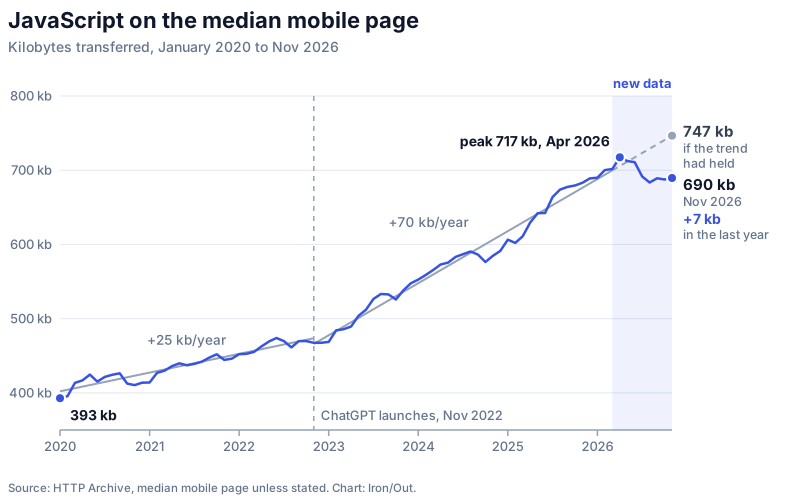
The median mobile page peaked in April 2026 at 717 kb of JavaScript. In November it is at 690 kb, a drop of 3.9%. Desktop fell further, from 803 kb to 756 kb.
Year on year the mobile median is still up: from 683 kb in November 2025 to 690 kb now, a gain of 7 kb. In the period Ethan analysed it gained about 70 kb a year, so growth is running at a tenth of that pace. On desktop the median is back where it was a year ago.
Had the post-2022 trend continued, the mobile median would be at 747 kb today. It is 57 kb below that line. With the new months included, the growth rate since November 2022 drops from 70 kb to 64 kb per year, and "2.8 times faster" becomes 2.5 times.
Total page weight follows the same shape. The median mobile page peaked at 2,683 kb in May and is now at 2,617 kb.
Small dips have happened before. In autumn 2024 the median lost 14 kb in two months and had recovered by December. This one is larger and has lasted seven months.
How much of the drop is real #
HTTP Archive does not measure the same sites every month. Its list of pages comes from the Chrome UX Report, and that list changes as sites gain and lose traffic. A median can move because pages changed, or because the set of pages changed.
To separate the two, we compared April with November in the raw crawl data on BigQuery, and split the home pages into three groups: those measured in both months, those that disappeared after April and those that were new in November.
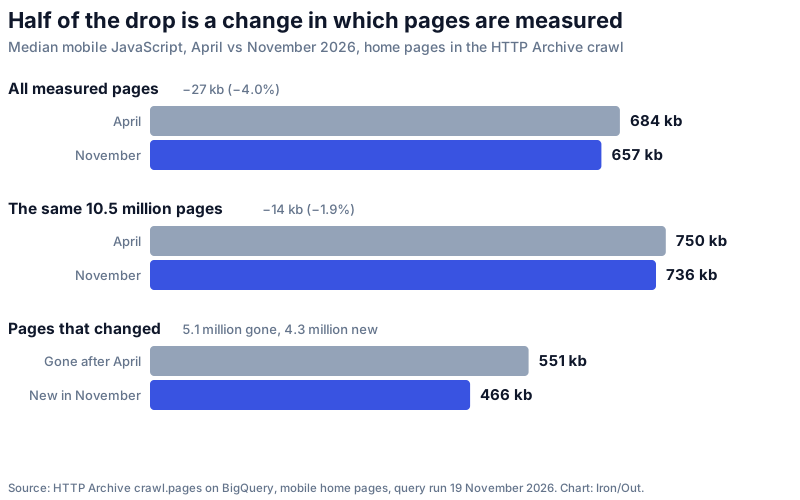
Across all home pages the median fell by 27 kb, or 4.0%. The 10.5 million pages that were measured in both months fell by 14 kb, or 1.9%.
The rest comes from turnover. The 5.1 million pages that left had a median of 551 kb. The 4.3 million that replaced them had a median of 466 kb. Lighter pages came in, and that pulled the overall median down without any existing page changing.
So the same pages did get slightly lighter. But the headline drop is about twice the size of what those pages actually shed.
The heaviest pages kept growing #
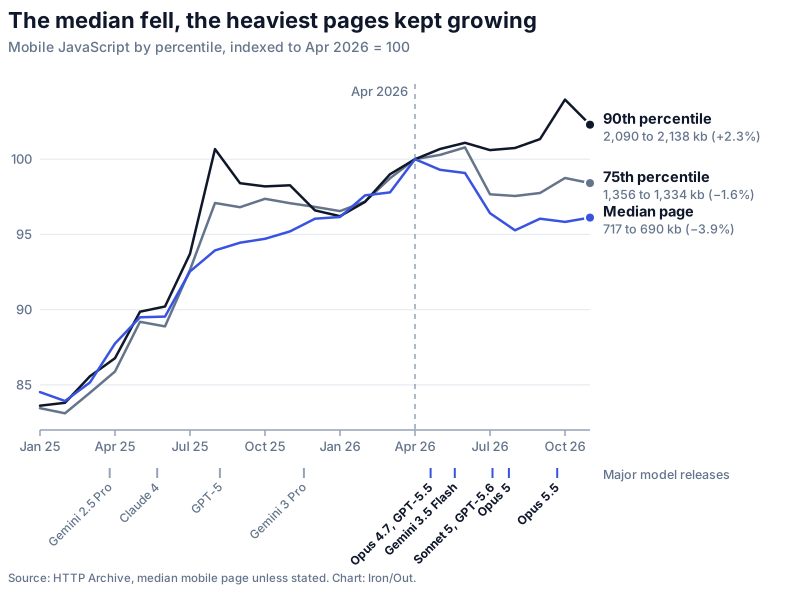
The plateau only shows up around the median. At the 75th percentile, mobile JavaScript fell by 1.6% since April. At the 90th percentile it rose by 2.3%, from 2,090 kb to 2,138 kb, and October set a new record of 2,173 kb. Desktop shows the same split: the median down 5.9%, the 90th percentile up 2.0%.
One in ten mobile pages now ships more than 2 MB of JavaScript. For that group nothing has levelled off.
The markers under the chart show the major model releases in this period. Claude Opus 4.7 and GPT-5.5 arrived in the weeks after the April peak, followed by Gemini 3.5 Flash in May, Claude Sonnet 5 and GPT-5.6 around the start of July, Claude Opus 5 later that month and Claude Opus 5.5 in September. Releases were just as frequent while the median was still climbing in 2025, so the timing does not single out any one of them.
What the growth is made of #
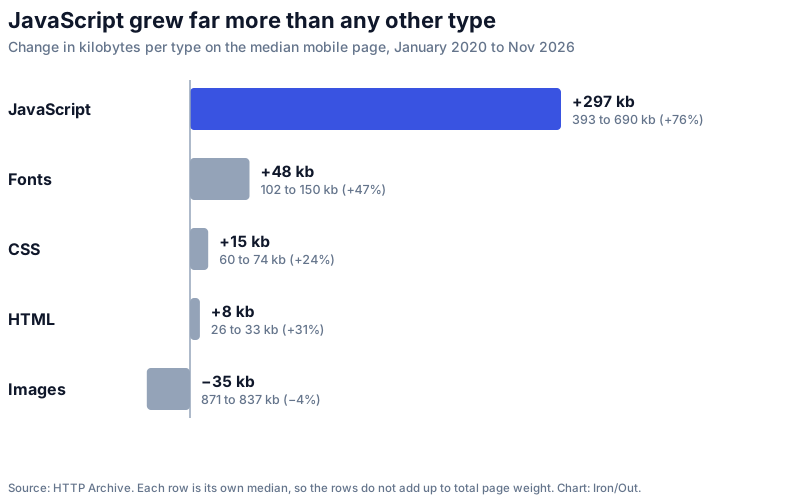
Over the whole period since January 2020, JavaScript grew far more than any other resource type: 297 kb more on the median mobile page. Fonts added 48 kb, CSS 15 kb and HTML 8 kb. Images got 35 kb lighter. Each type has its own median, so these numbers do not add up to the 847 kb that the median page gained in total.
A byte of JavaScript costs more than a byte of anything else. An image is decoded and painted. JavaScript has to be parsed, compiled and run on the phone's main thread, where it competes with every tap and scroll.
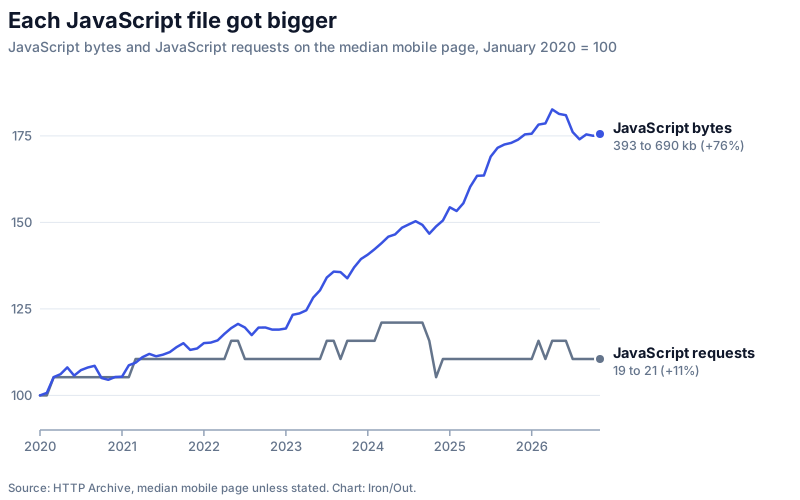
The number of JavaScript files barely moved, from 19 to 21 requests. The bytes inside them grew by 76%. Dividing one median by the other gives about 21 kb per file in 2020 and 33 kb now. The total number of requests per page is the same as in 2020: 69.
Pages load about as many scripts as before, and each one is bigger.
The wait barely got shorter #
HTTP Archive also loads every page on an emulated mid-range phone with a throttled connection. On that fixed device the median time to interactive was 12.5 seconds in January 2020 and is 11.8 seconds now. That is seven tenths of a second in almost seven years.
Real users have fared better. The share of sites that pass Core Web Vitals on mobile went from 24% in January 2020 to 53% in October 2026. That is not a like-for-like comparison, because the metrics behind the assessment changed along the way and phones and networks improved. Pages did not get lighter over those years, so the gains came from elsewhere: faster phones, networks and browsers, and sites fixing specific metrics.
What we can say so far #
JavaScript on the median page is still growing year on year, but at about a tenth of the pace Ethan measured. It is too early to say whether that will last.
The data supports four statements:
- The median mobile page gained 7 kb of JavaScript in the past twelve months, against about 70 kb a year between November 2022 and March 2026.
- Since the peak in April it has fallen by 3.9%. About half of that is existing pages getting lighter. The other half is a different mix of pages.
- The heaviest pages are still growing.
- 690 kb is still 76% more JavaScript than in 2020, and it reaches the phone in almost the same number of files.
The data does not show a cause. The acceleration after November 2022 coincided with the adoption of AI, and nobody has shown that AI wrote the extra code. The plateau does not show the opposite either. Seven months is a short series, and the turnover in measured pages shows how easily a median moves for reasons that have nothing to do with how anyone builds websites.
We will rerun this analysis in the spring.
Method and sources #
- Monthly series: HTTP Archive's public report data for JavaScript bytes, total bytes, images, fonts, CSS, HTML, JavaScript requests, total requests and time to interactive. Mobile, median, January 2020 to November 2026, 83 monthly points. Percentiles and desktop where stated.
- Trend lines: ordinary least squares on two segments that share November 2022 as their breakpoint, following Ethan Gardner's approach. He does not publish his fitted slopes, so the kb per year figures are our refit.
- Same-page comparison:
httparchive.crawl.pageson BigQuery, mobile home pages, April and November 2026, joined on page URL. These medians are lower than the report series, which is computed differently, but both fell by about 4% between April and November. - Core Web Vitals: the Chrome UX Report series published by HTTP Archive, which runs through October 2026.
- Model release dates: the announcements by Anthropic, OpenAI and Google. Releases within about a week of each other share one marker.
Get more business out of your website
Find out how much slow pages are costing you, and what to fix first. Takes 30 seconds, no commitment.
