How to solve Interaction to Next Paint (INP) issues

After a year of testing, Google announced at Google I/O 2023 that INP will be promoted from an experimental status to a stable Core Web Vital metric for responsiveness, replacing the First Input Delay (FID) metric (as from 12 March 2024). In May 2022, Google introduced the new Interaction to Next Paint (INP) metric at the Google I/O event and added it to the Chrome UX Report (CrUX) as an experimental metric. Like FID, INP measures how quickly a page responds to user interaction. INP measures all interactions with a page throughout the session, while First Input Delay measures only the first interaction with a page. INP is a full-page lifecycle metric, just like Cumulative Layout Shift (CLS).
Over the past year, the availability of INP as an experimental metric has made it quite clear to us that many pages and sites are underperforming in terms of responsiveness. While there were few or no responsiveness issues for the 75th percentile of all site users according to FID, INP shows that UX, especially for smartphone visitors, performs moderately to poorly on this aspect.
The 2022 Web Almanac from httparchive.org investigated the effect of INP as a hypothetical Core Web Vitals (CWV) metric. If INP were to be a CWV metric today, only 20% of the top 1k mobile websites would have good CWV with INP, a decrease of 32 percentage points compared to the same top 1k websites having good CWV with FID (52%).
For UX aspects like loading speed and visual stability, LCP (Largest Contentful Paint) and CLS (Cumulative Layout Shift) are both very relevant metrics for measuring a good user experience. With INP, we now also have a relevant responsiveness metric. One thing is certain: INP is more challenging than FID. This article describes why INP is a relevant user-centric Core Web Vitals metric, and how issues with INP can be solved.
Prompt visual feedback is key for INP #
When a page responds quickly to user interactions, we describe this as good responsiveness. Users experience responsiveness in the form of visual feedback. Technically, this visual feedback is shown to the user in the next frame the browser renders, after the interaction has taken place.
A mobile navigation menu being opened, showing an added item to a shopping cart or validation notifications of input fields inside a registration form are examples of relevant visual feedback following interactions. In case a backend server or third-party resource is invoked after interaction, a prompt visual hint is even more relevant because of additional network latency and backend processing times. It is important to provide some initial visual feedback quickly as an indication to the user that something is happening.
The time until the next paint is the first occasion to respond with a visual cue to the user. For INP, it is vital that the time between a user interaction and when the next frame is painted is as short as possible. Even if the first update is a loading spinner.
Why are interactions delayed #
Interactivity in browsers is mostly driven by JavaScript. Clicking a mouse, tapping on a touch screen or pressing a key on a physical or onscreen keyboard are relevant interaction types for INP. Hovering and scrolling does not factor into INP.
Each interaction consists of three phases: input delay, processing delay and presentation delay. Whereas FID measures only the first phase, INP measures all phases and especially the visual response (UI update) as result of the last phase is relevant to the user, who expects an immediate visual feedback after each interaction.
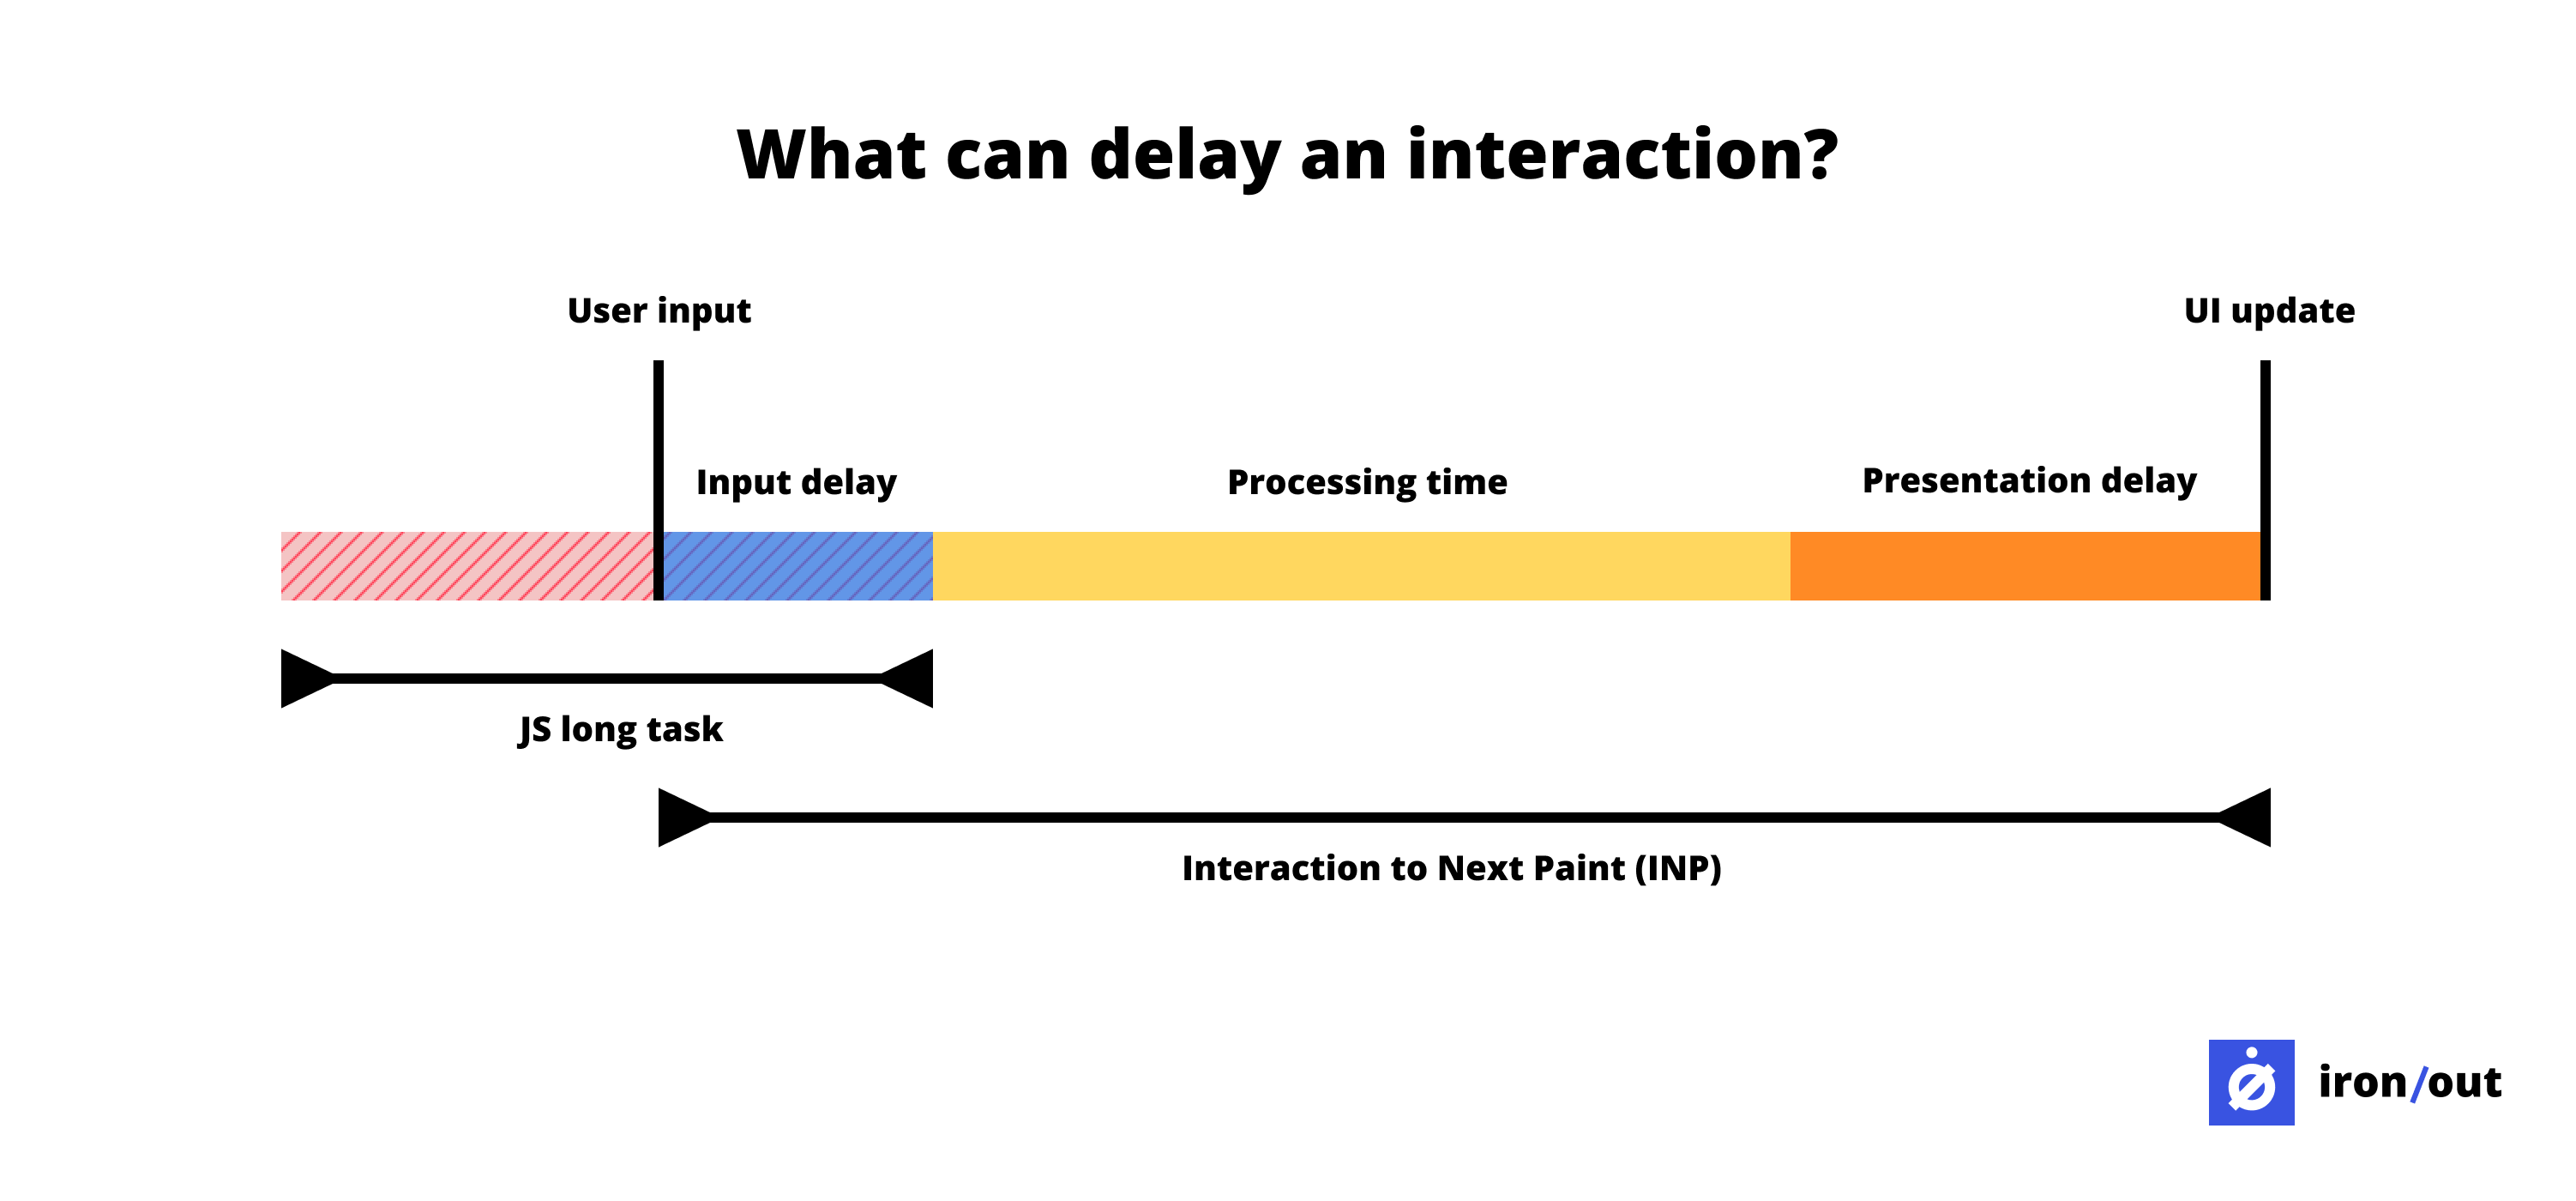
Input delay #
Input delay is usually slowed down by JavaScript long tasks. Tasks are operations performed by the browser and JavaScript is a major source of tasks. The browser or actually the browser's main thread can only handle one task at a time. When a task lasts longer than 50 milliseconds, we call it a long task. If the user interacts with the page during execution of a long task, the browser has to complete the task before it can receive user input. The browser cannot interrupt a task that's in progress. It's likely that the user will notice the delay and perceive the page as sluggish or janky.
The duration of a long task varies from device to device as it depends heavily on the processing power (CPU) of the device. It is therefore necessary to test and monitor on-page interactions on similar devices in use by your site visitors.
Although long tasks can occur in your own code, the use of third-party resources is often underestimated. When using third-party tracking and tooling, JavaScript is often the main component that your own pages have to load and run, resulting in poor responsiveness.
Processing time #
After the user's input (e.g. click, tap or key interaction) is received by the browser, the browser responds to it via event callbacks. It is important that the browser can process these functions as quickly as possible.
Therefore, limit the code to be executed to the logic needed to apply visual updates for the next frame. For example, logic for opening a mobile navigation menu should be in a separate or inline script. When the page loads and renders the menu icon, this prompts users to interact. If the browser has yet to load the logic at that point and it is in a large JavaScript bundle, this requires some additional loading and processing time (the entire JavaScript bundle must be processed first).
The result is a presentation delay, the visual update (sliding in and showing the menu) is delayed. This poor responsiveness often leads to rage clicks among visitors (because they receive no visual feedback), to which the browser responds by sliding the menu in and out multiple times, because each click is a task that the browser processes.
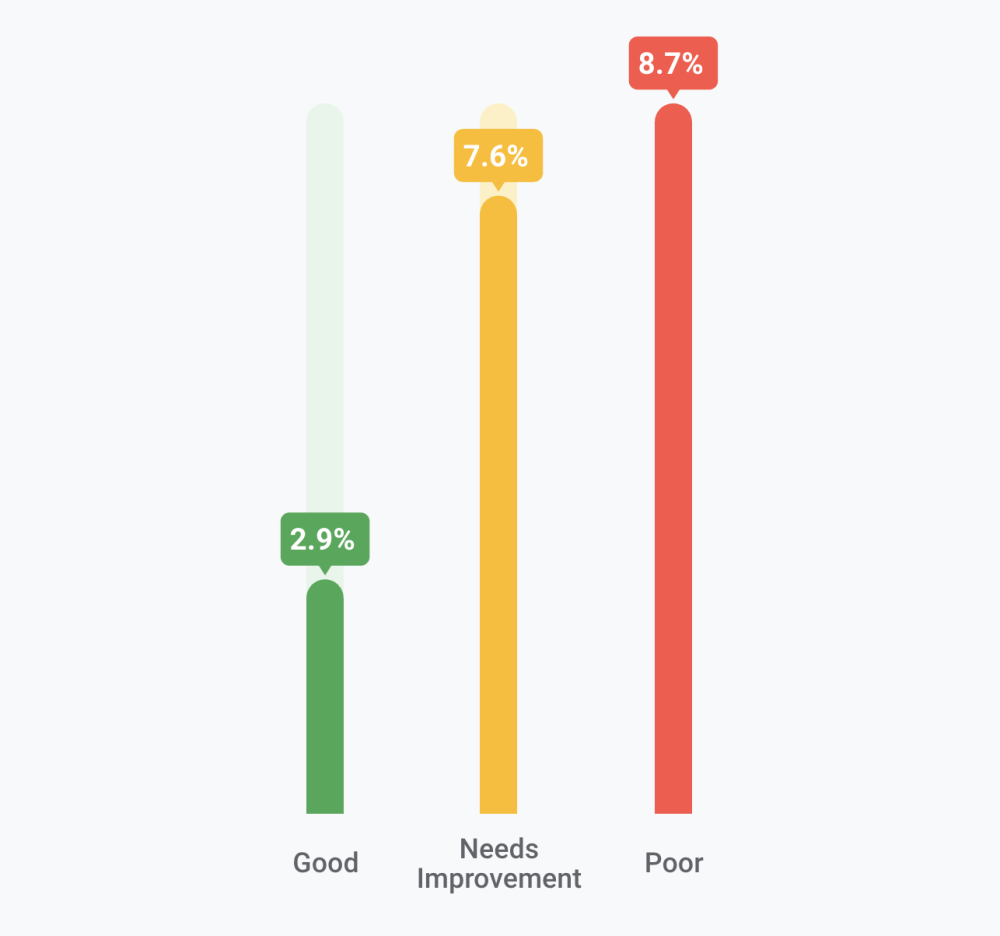
Rage clicks are when users repeatedly click (and click and click) in a certain area or on a specific element of your website over a short period of time. Rage clicks are a good indicator for measuring user frustration. Annie Sullivan, a Google Chrome software engineer conducted research on rage clicks and noted that Chrome page loads with "Good" INP have a much smaller rate of rage clicks than page loads with "Needs Improvement" or "Poor" INP (see image above).
Presentation delay #
The presentation delay is the last phase of an interaction. It is the time between when the event callbacks are completed and when the browser can present the next frame on the user's screen.
Unfortunately, presentation delays are the least of your control. A number of things that slow down frames can be taken into account, but it is especially important to optimise the previous phases.
How to debug INP issues? #
To debug INP issues, you will need to find out which pages have responsiveness issues and which interactions cause problems. Perhaps you have observed issues yourself, or users of your site have experienced issues and shared their experiences. When you have RUM software installed on your site capable of capturing attribution data for INP (e.g. Google Web Vitals library), you can use it to detect specific UX problems experienced by real users.
To resolve issues with INP, you will need to analyse the activity of the browser main thread. However, the performance tab in Chrome Devtools is quite overwhelming. Fortunately, there is an easier way to look for INP issues and what interaction delays are involved.
Using Lighthouse's timespan mode #
Once Lighthouse's timespan mode is enabled, interactions with the page are analysed by Lighthouse and detailed in an audit. This audit reports what time was spent on interactions and specifically for input delay, processing delay and presentation delay.
Phil Walton, a Google Chrome Web Performance Engineer, created an Interaction to Next Paint (INP) Live Demo application to get a feel for the INP metric. The demo allows you to control the level of main thread blocking, so you can see how different types of interaction latencies translate to a given INP score.
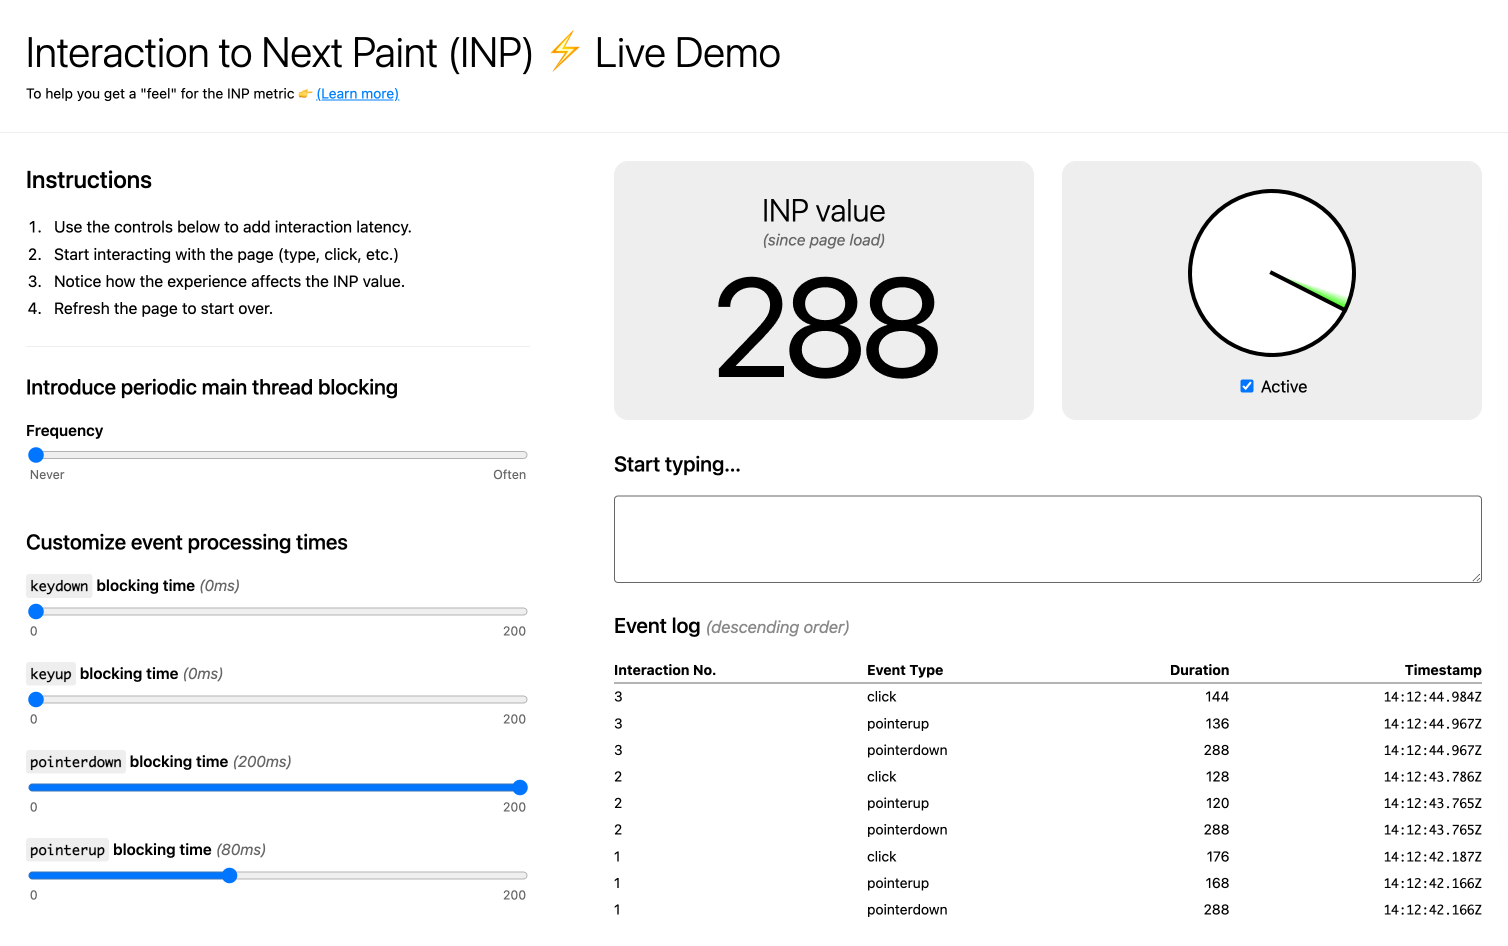
In the first scenario, there is a 200 ms blocking time on the pointerdown event, and 80 ms blocking time for the pointerup event. After several clicks on the page, the highest measured INP is 288 ms.
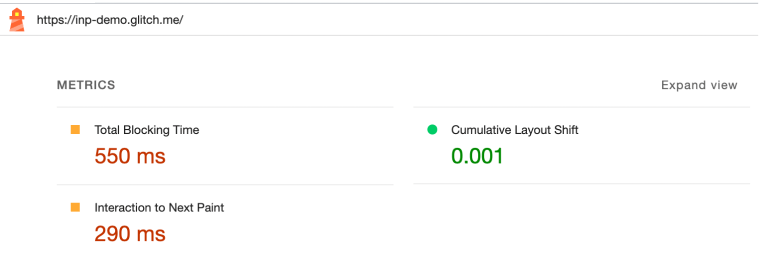
During these interactions, Lighthouse timespan mode measured an INP of 290 ms, where 200 ms delay was due to processing time and over 80 ms due to a presentation delay. This corresponds to the event processing times as set in the demo.
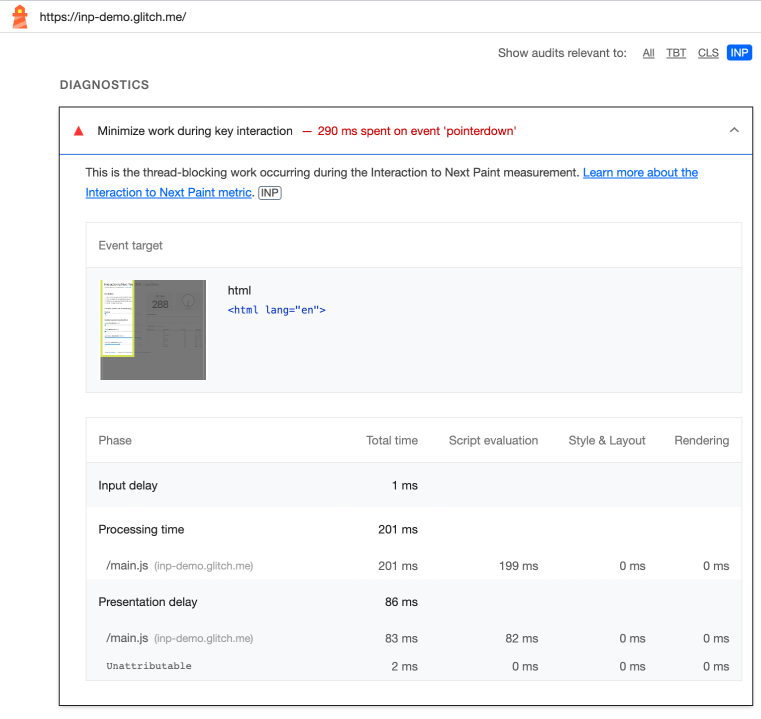
Note that the delay in these interactions was observed for events (and tasks) triggered by that input (after the browser received the user's input). In a regular web page with these kinds of INP issues, you are likely to see several specific sources reflected in this audit where the cause or causes may lie.
In the second scenario, the frequency of blocking the main thread is increased to a frequency of ‘often’ (instead of ‘never’ in scenario 1).
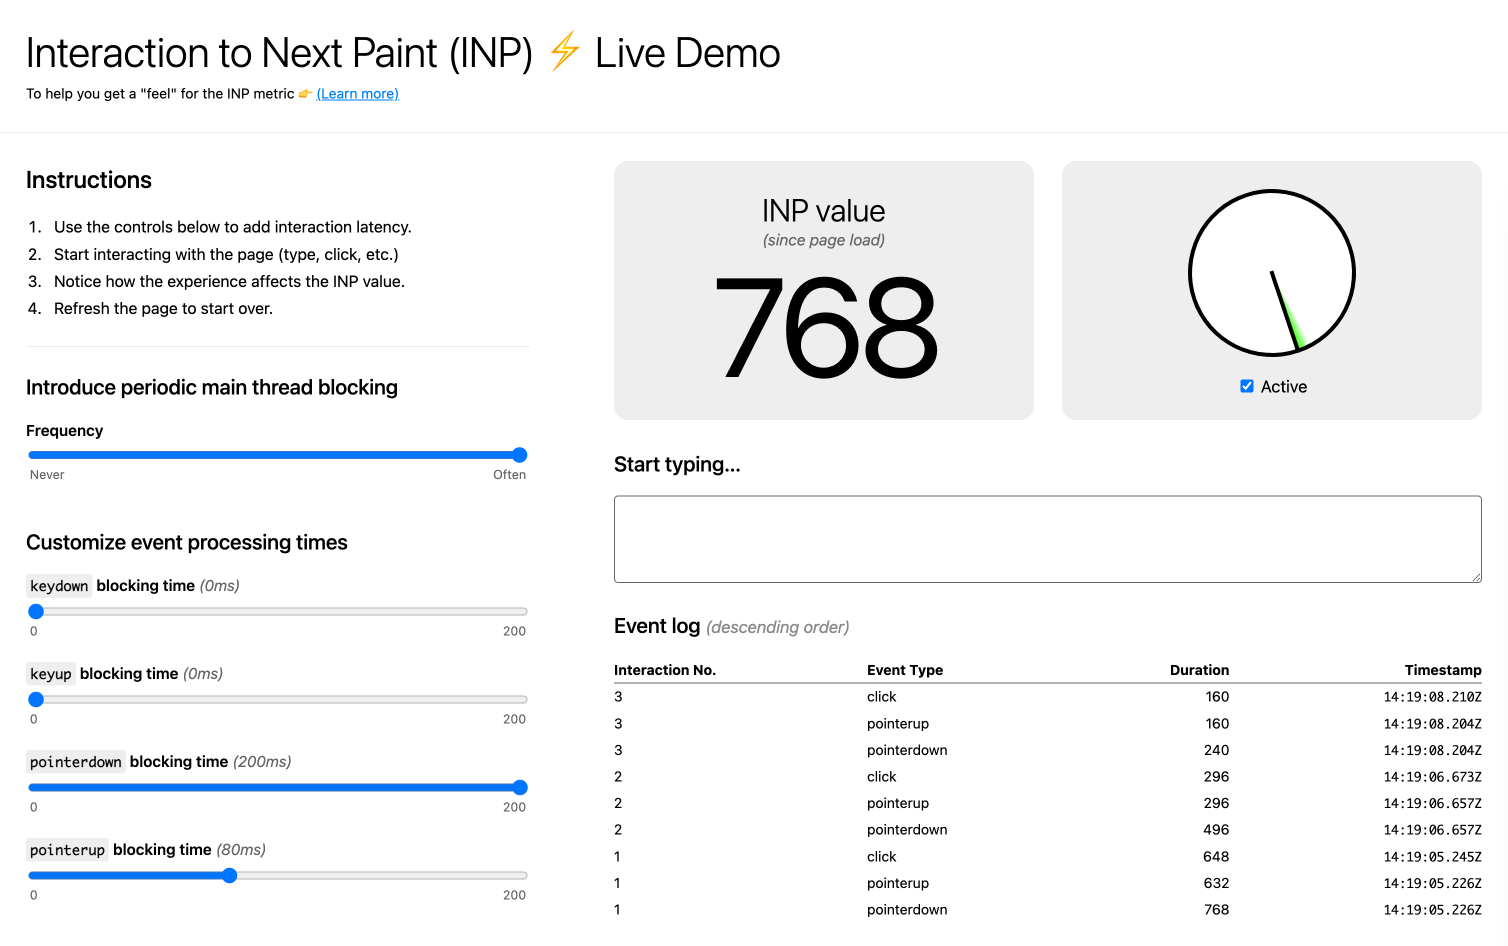
Now the main thread is more often busy with tasks and therefore more frequently unable to directly receive input from users. After several clicks on the page, the highest measured INP is 768 ms.
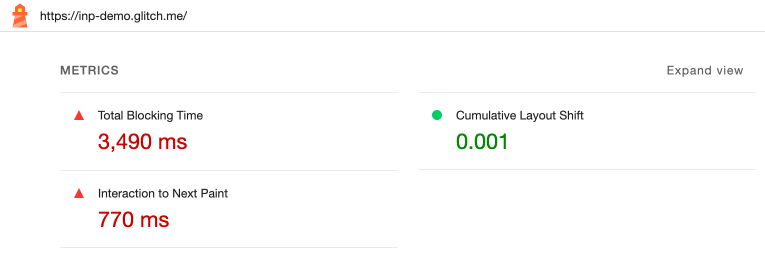
During these interactions, Lighthouse timespan mode measured an INP of 770 ms, again 200 ms delay was due to processing time and over 80 ms due to a presentation delay. This time the increase of long tasks (main thread blocking) affects the input delay with an increase of around 480 ms.
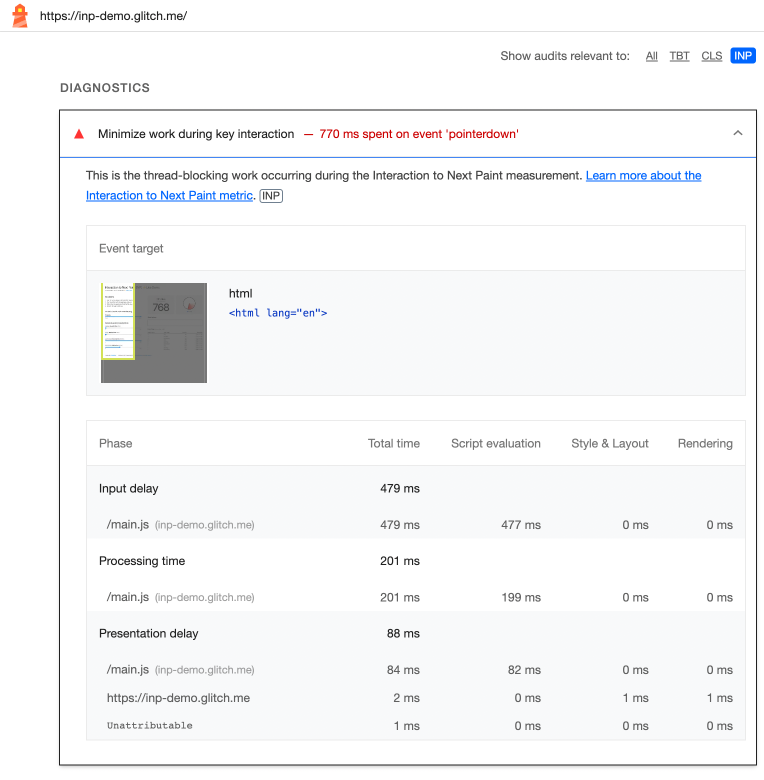
In both scenarios, these delays are related to script evaluations. From these scenarios it has become clear that a high INP score can be caused by different delays but can also have different causes.
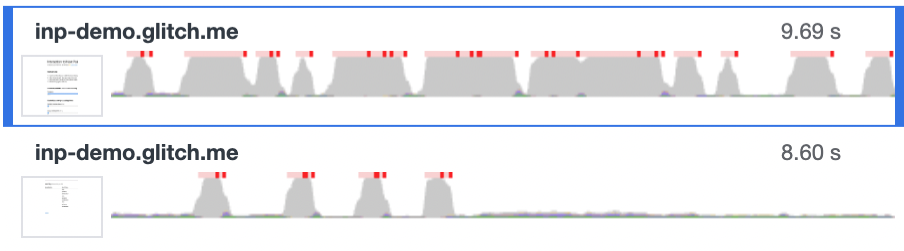
Scenario 2 (image inside blue frame) clearly shows that the browser's main thread (CPU) is actually constantly busy with processing long tasks (in red), while in scenario 1 it is only in response to clicks.
Total Blocking Time (TBT) #
Total Blocking Time (TBT) is a lab metric for responsiveness. TBT is the total time where the main thread was blocked from receiving user input. TBT is the total time of all JS long tasks, and counts only the blocking time for each task excluding the first 50 ms. TBT is measured between the key user moments First Contentful Paint (FCP) and Time to Interactive (TTI). Although the TTI metric has been removed from Lighthouse 10, the measurement of TBT remains unchanged.
There is a relationship between TBT (a lab metric) and INP (a field metric), a high TBT measured in lab data is likely to result in elevated INP values in field data. When TBT issues in lab data are fully resolved it will also eliminate INP issues experienced by real users.
What are the implications now that INP is part of Core Web Vitals? #
With INP, we have a relevant responsiveness metric. Not only does this metric give us a better understanding of the extent of responsiveness issues, we also see where specific delays occur.
INP will make many site owners aware of responsiveness issues that were not revealed with First Input Delay. With the help of this metric, we are better able to improve the UX of sites in terms of responsiveness, in addition to aspects such as loading speed and visual stability.
Like the Core Web Vitals metrics LCP and CLS, INP will be part of the Core Web Vitals assessment in March 2024. With INP replacing the metric FID within the assessment, it is expected that many mobile sites will fail the assessment. And that could affect Google organic rankings (SEO). The results of this assessment are used as signals of page experience used by Google's core ranking systems for Google Search. If you score ‘good’ on all three Core Web Vitals you can gain better ranking positions.
According to Google the page experience ranking factor, where the Core Web Vitals are part of, is not huge for SEO. It might be more like a tie breaker signal, which means it can make a difference when you are in the top three fighting against your competitors for the first position. Meeting the Core Web Vitals will not take you from the top 10 to the top 3 in terms of rankings, as the influence of other relevant factors are more significant. Therefore, improve responsiveness mainly from the point of view of keeping your site's users happy. Don't wait until INP becomes a Core Web Vital in 2024 to start improving it. Start now! Because happy users do more, buy more and will return to the site more often, and so does traffic from the SEO channel.
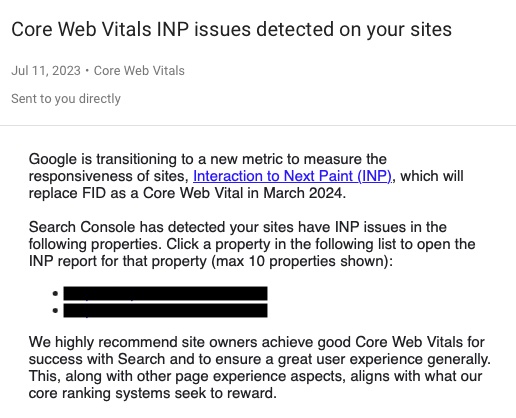
'Core Web Vitals INP issues detected on your sites' #
Since mid-July, site owners have been notified (via Google Search Console) of INP issues that Google has identified for visitors of your site(s). You may have received an email with the subject 'Core Web Vitals INP issues detected on your sites' or seen the notification of this in Google Search Console.
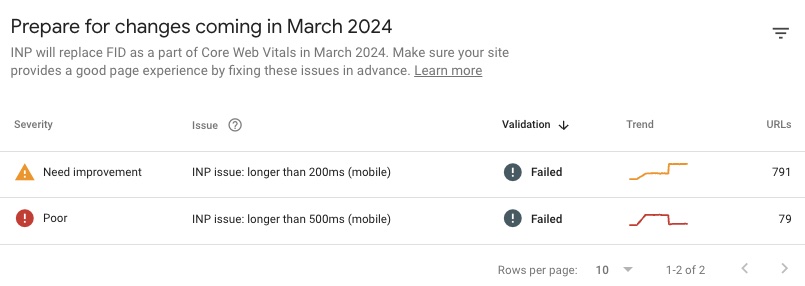
The links of sites (Google calls them properties) from this notification lead you to a new INP report so you can prepare for the changes coming in March 2024.
Like the current reports, you can see which URL or groups of URLs have INP issues and to what extent.
Depending on the number of URLs and the degree of responsiveness issues the report indicates two levels of severity. These correspond to the INP thresholds for poor and moderate experiences:
- Need improvement
- Poor
Notifications for smartphone devices (mobile) are more likely to be reported than desktop because of less powerful processors (CPU) in these mobile devices.
This report will not help you find out what causes these INP issues, but it will help you find out where visitors to your site are suffering from them.
If you have fixed the INP issues, you can have Google revalidate the pages to verify some weeks later (due to delays in Google CrUX data) whether you have fixed the issues for your users.
Despite the fact that Google gives site owners very valuable insights with the Chrome UX Report (CrUX) and the availability of this data in Google Search Console, we recommend using a Real-User Monitoring (RUM) tool that reports real-time insights into INP issues.
Conclusion #
Web Performance Optimisation focuses on three UX aspects: loading speed, visual stability and responsiveness. First Input Delay (FID) measures how quickly a page responds to user interaction, but measurement is restricted to only the first phase (input delay) of an interaction.
With Interaction to Next Paint (INP) we have a better metric at our disposal because, in addition to input delay, this metric also measures delay in processing time and visual feedback after the browser is able to receive user input (mouse click, screen tap, key press).
Mobile website visitors in particular experience responsiveness issues due to long JavaScript tasks. The duration of these blocking tasks is strongly dependent on the computing power of a device, which blocks the browser from responding directly to user input.
Fortunately, with the help of INP, we are also better able to analyse where, in which phase and for what reasons, the responsiveness of pages is not optimal, so that we can actually improve these interactions.
That Google has now chosen to replace the Core Web Vitals metric FID with INP confirms that this user-centric is better than FID at measuring, examining and monitoring responsiveness issues.