How web performance impacts your business

Improving the pagespeed and page experience of your company website… How big of a priority is this for your business? You might see it as a task for developers, for if they have any time left. Or you might see it as an essential part of your business. Are you a rockstar when it comes to website performance? Or you don’t know what it is? Whatever the answer is, this blog will help you understand what impact website performance optimisation has on the commercial side of your business.
What is website performance? #
Before we start with all the technical stuff, let us start with a little example. The average time that a website user wants to wait is two seconds, about the time it took to read this sentence. Two seconds seems quite short but if you are navigating yourself through a website and for instance checking products, you probably like to stay in a certain flow: the website should load fluently and you do not want to wait too long. If it would be too long you would probably not hesitate to look for that little cross in the upper right corner of the page: you would go away without taking any action. So in short, speed is important for web performance but there is more.
When we talk about website performance optimisation at Iron/Out we actually mean providing a good user experience. This can be the experience on the website as a whole, but also per specific page. In that case we talk about page experience. Google introduced three basic metrics called the ‘Core Web Vitals’ to determine good user experience:
- Largest Contentful Paint (LCP) which measures loading performance. To provide a good user experience, a site should load their LCP within the first 2.5 seconds of the page starting to load.
- First Input Delay (FID), which measures interactivity or easier: how quick a website responds to certain requests. To provide a good user experience, a website should strive to have an FID of less than 100 milliseconds.
- Cumulative Layout Shift (CLS), which measures visual stability. To provide a good user experience, the CLS score should be less than 0.1.
Next to the Core Web Vitals there are other Web Vitals like Time to First Byte (TTFB) and First Contentful Paint (FCP), which are both vital aspects of the loading experience, and are both useful in diagnosing issues with LCP. Furthermore, metrics like Total Blocking Time (TBT), Interaction to Next Paint (INP) and Time to Interactive (TTI) are vital in catching and diagnosing potential interactivity issues that will impact FID. These metrics are the ones that Google uses but performance can be measured by many other metrics which could be measured with analytics software: a high bounce rate, low amount of click throughs, short time on page or many premature website exits could also indicate there is something wrong.
All these metrics strive to measure website performance objectively, but that does not say anything about how website users perceive performance.
The challenge of increasingly demanding users #
Users are becoming more and more impatient with websites that take a long time to load. This is partly due to the fact that they have become accustomed to instant gratification, as seen on social media platforms like Facebook, Twitter and Instagram. On the other hand, these platforms are also functioning very well from a performance point of view, so they set a certain standard: people expect this everywhere. Even if the website is not loading quickly, it should at least look good as soon as possible and every millisecond counts as we have shown before.
Next to that, website owners also want to provide a better experience to their visitors by designing and implementing visually appealing content. This creates another issue: websites and pages are rapidly increasing in size.
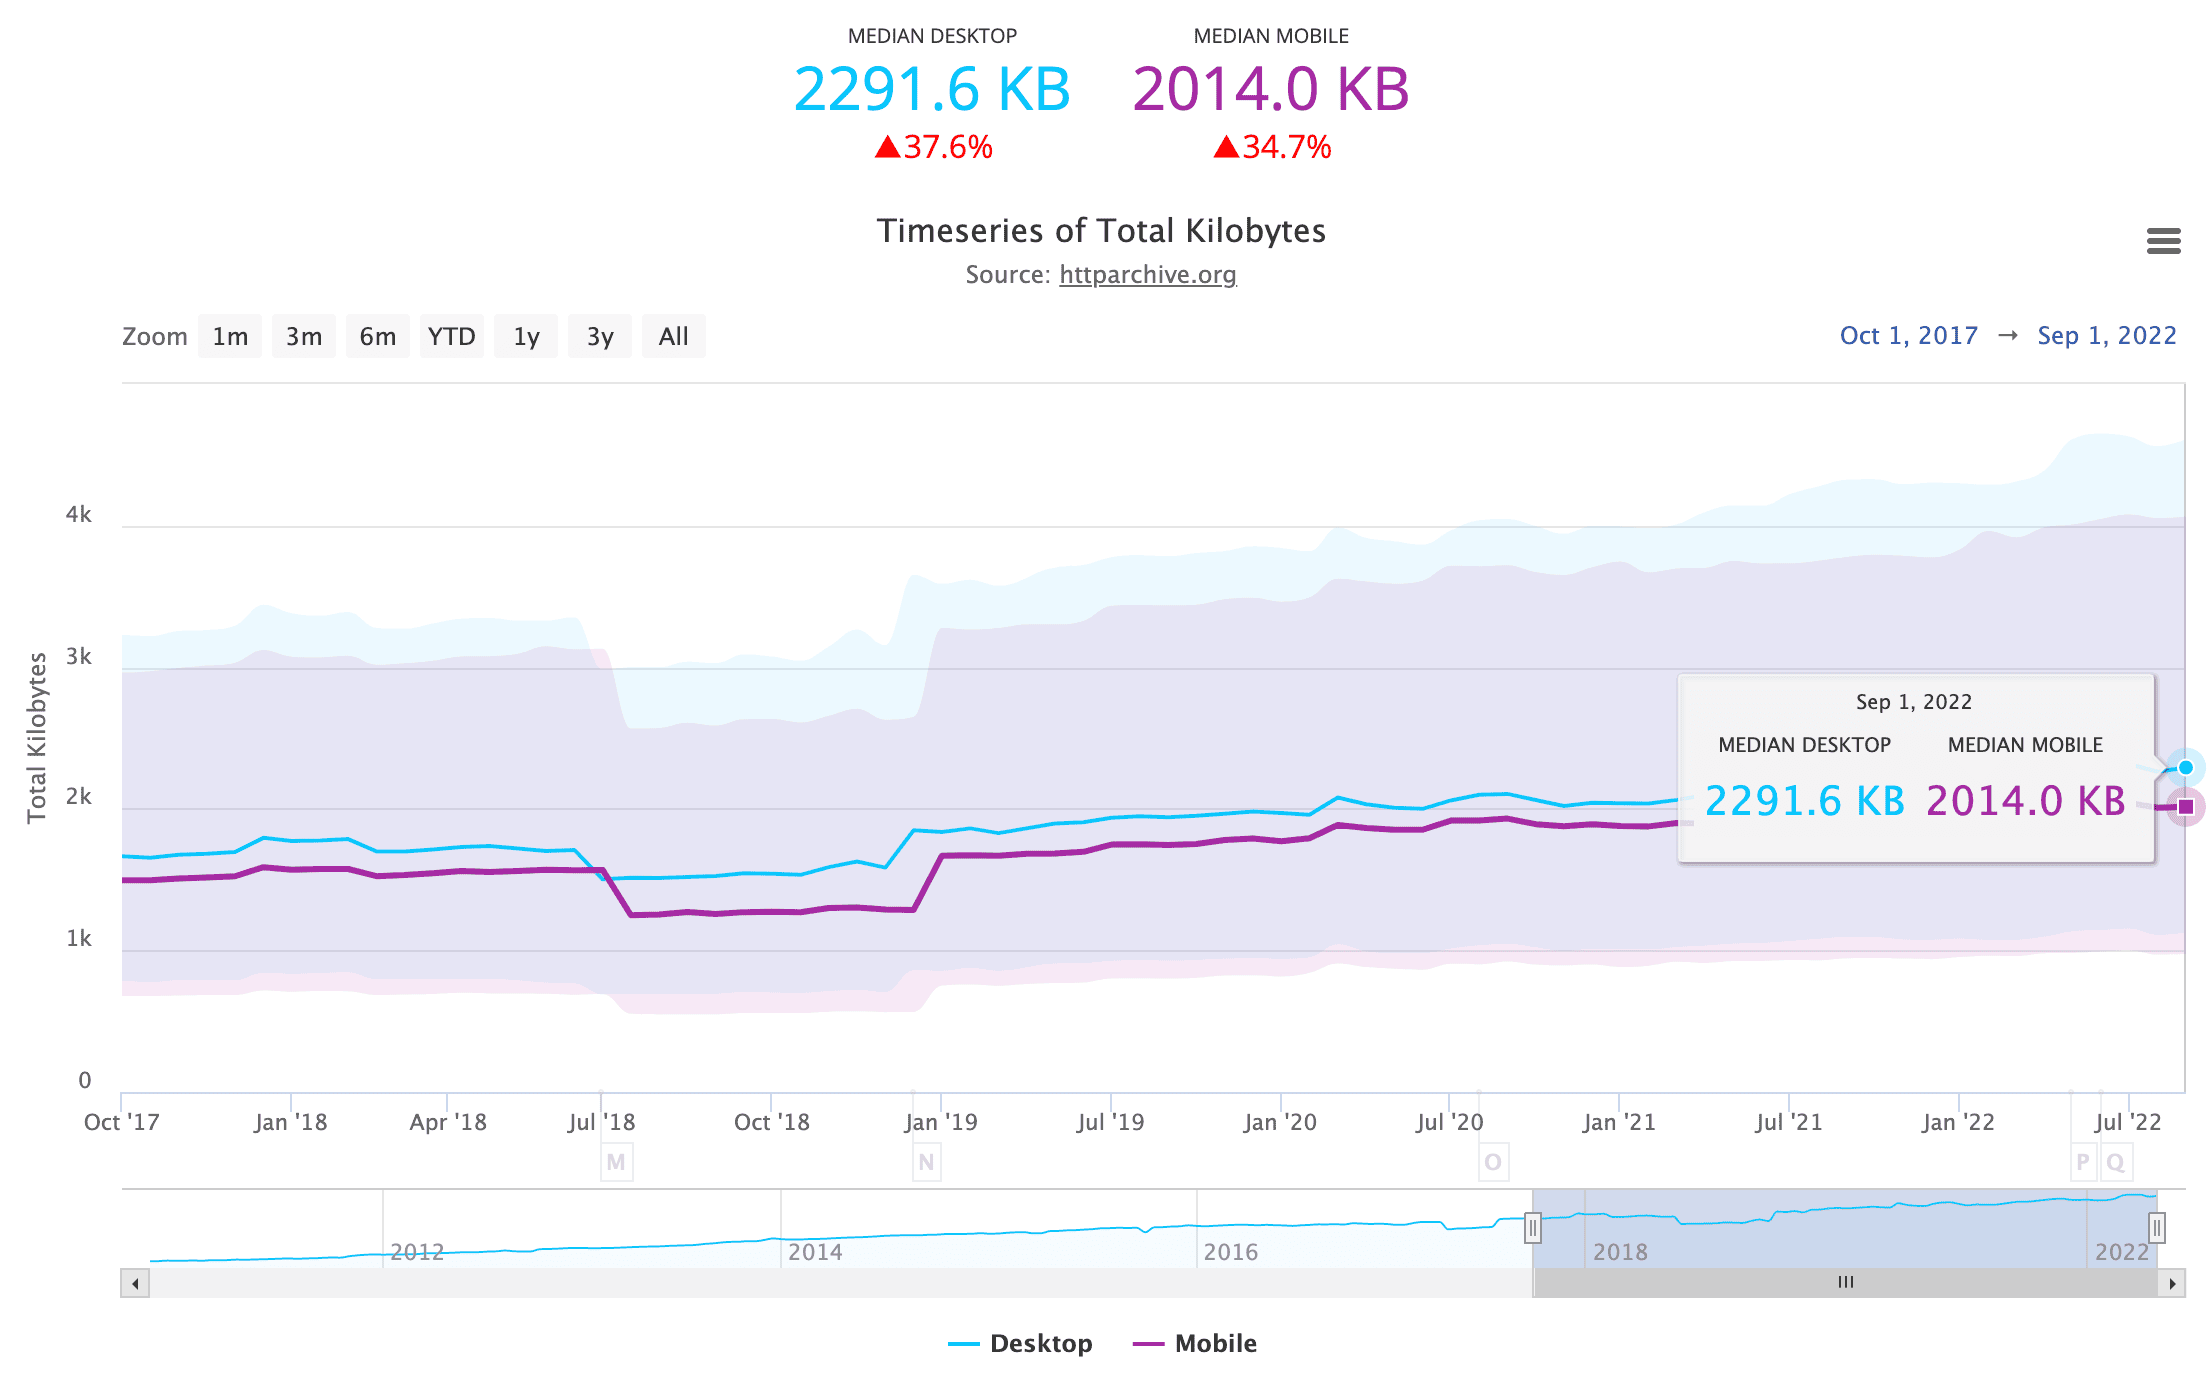
(Source: HTTP Archive State of the Web)
To conclude, people get more demanding in terms of loading speed while websites increase in terms of loading size. This creates an issue for developers which cannot always be technically solved. The next paragraph will explain this further.
How do users perceive performance? #
Next to the developer metrics, there are also user-centric metrics. Even if a website scores good on the developer metrics, it can still feel slow to users. That is because it’s not just about speed but also about visual aspects such as animations, transitions and how smooth everything goes. While a developer sometimes can not physically increase a website’s performance, it might be possible to change how the website feels to a user. An example of this: when a page loads it’s better to show the text as soon as possible while other resources like images can wait. In this case, changing the order of loading could improve the perceived web performance.
To wind up, improving the performance of your website does not necessarily mean that the performance metrics should be improved. Website performance optimisation has an objective and subjective side: both should be considered when improving a website. By doing so, the website does not necessarily need to load quicker: it just needs to feel quicker and in some cases this overcomes difficult technical solutions.
At Iron/Out we get quite some questions from companies that score sufficient in performance tests but still look and feel slow. Our technical lead Sander van Surksum is specialised in these kinds of issues and an extensive performance audit can expose those issues.
What is the link between website performance and commercial results? #
In a 2020 study, Deloitte analysed the mobile website data from 37 retail, luxury, lead generation and travel brands in Europe and the United States. They found that if a website would only load 0.1 seconds quicker, this would result in:
- More pageviews per session.
- A lower bounce-rate.
- An improvement of the customer engagement..
- Ultimately, this would lead to a higher conversion rate, in some cases more than 10%.
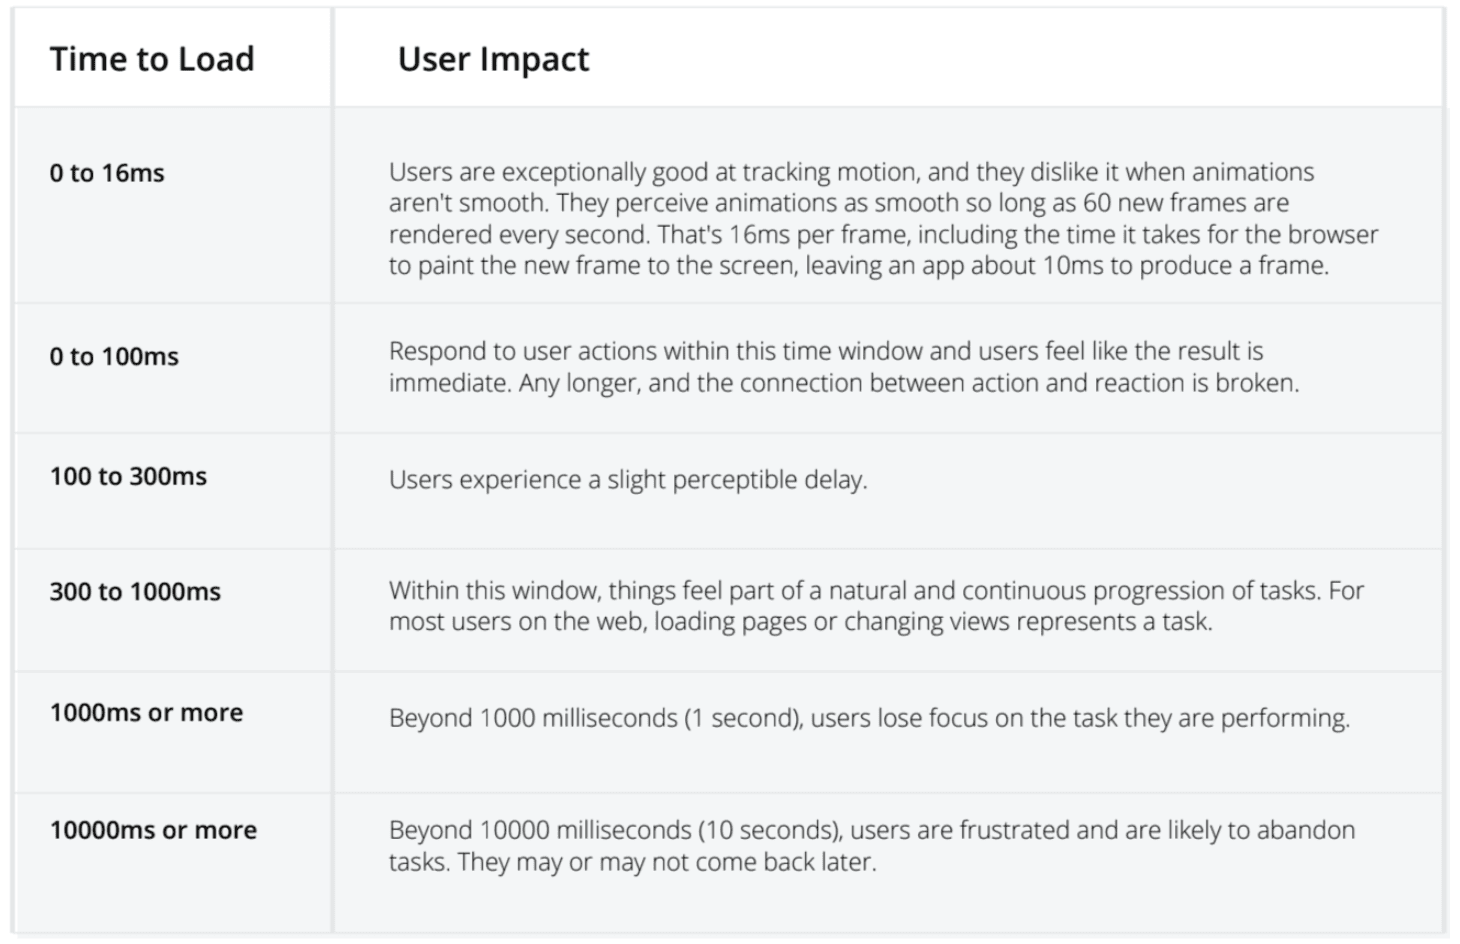
Every 0.1 seconds count but if a response takes more than 1 second, people will lose interest like the table from the research shows below. Above 10 seconds, the issues are really too big to cope with and abandoning your website will be imminent.
The four metrics that Deloitte found are in line with our own experience. However, we found some other positive effects of websites with a good page experience:
- More impressions in Google Search, partly due to the reward from Google for good performing websites.
- The average session duration increases.
- Users return more frequently.
- More clicks on elements and click throughs.
- Higher advertising revenue.
- Lower server costs due to less requests/ lower page sizes.
Get more business out of your website
Find out how much slow pages are costing you, and what to fix first. Takes 30 seconds, no commitment.
Many of the aforementioned metrics are considered as important business KPIs. in some cases, they are used to predict or explain commercial results - the conversion from a visitor to a lead, signup or sales - based like the impressions, bounce rate, pageviews, time on page, return rate and engagement. Therefore, many people in the commercial side of the company are used to monitoring the metrics. However, we also see that specific actions to improve these metrics are not always top-of-mind. If companies do take action, you could see results like:
- Farfetch web conversion rate would increase by 1.3% with each 100ms reduction in Largest Contentful Paint (LCP).
- The Economic Times passed Core Web Vitals thresholds and achieved an overall 43% better bounce rate.
- By measuring real users' Web Vitals, Rakuten 24 also found that a good Largest Contentful Paint (LCP) can lead to a conversion rate increase of 61.13%.
- Renault found that 1 second LCP improvement can lead to a 14 percentage points (ppt) decrease in bounce rate and 13% increase in conversions.
If you’re still not convinced about the positive impact of good website performance on your business results, you can read more cases on Web.dev or WPO stats. To give you a little heads up: there are many and most of them are in line with results at our own clients.
To conclude: the success of any digital initiative depends heavily on speed, and especially for e-commerce and transactional websites. Only a fraction, a millisecond of performance improvement could have a huge positive impact on your commercial success. That is why it’s easy to advise you to put web performance high on your priority list. But how do you measure a website’s performance?
Which tools can you use to measure web performance? #
Logically you cannot improve performance unless you can measure it, because it provides important metrics to help you assess the success of your app, site, or web service. There are many tools available to measure your website's speed and other performance and we already mentioned the tools from Google. However there are many more and perhaps more extensive tools, but with a different focus.
Before we start with the tool itself it is important to know that there are basically two ways of measuring website performance:
- In a lab setting where a visitor or website traffic is simulated in a controlled environment. Lab testing (or synthetic testing, synthetic monitoring) is especially useful when you want to control certain factors like location, network, device (settings) or other conditions so every testrun can be reproduced.
- In a field setting with real-user monitoring (RUM). With RUM, data will be collected from all users, allowing you to correlate real business metrics with performance metrics and vice versa.
Some lab testing tools that we like to use are:
- Google PageSpeed Insights (for Lighthouse)
- GTMetrix
- Treo.sh
- PageSpeed.compare
The RUM testing tools we prefer are:
- Mpulse (Akamai)
- Dynatrace
- Catchpoint
- SpeedCurve
- Google PageSpeed Insights (for the Core Web Vitals)
Depending on the data we want to retrieve we typically use a set of 2/3 tools per case. The larger commercial websites we work on often already work with one of the tools we mention, for instance with the easy to use and popular SpeedCurve.
Conclusions #
In this blog we learned about web performance and the relation to user and/or page experience. We saw which metrics we use to measure performance in an objective way and which tools we can use to measure them.
Websites are increasing in file size while users demand faster loading times, so delivering a good experience by a high performing website is getting harder. However it pays off to have website performance high on the agenda, because every millisecond improvement can have a dramatic effect on commercial performance like conversion rates.
At Iron/Out we can assist companies in assessing website performance but also help to solve the performance issues. If you want to know the current state of your website, you can test it with our tool on our homepage. Perhaps your website scores well, in that case we can help you to keep it that way by preventing regression. If your website scores poorly, we can improve your website until it performs sufficiently. If you have any questions, feel free to reach out!
Get more business out of your website
Find out how much slow pages are costing you, and what to fix first. Takes 30 seconds, no commitment.